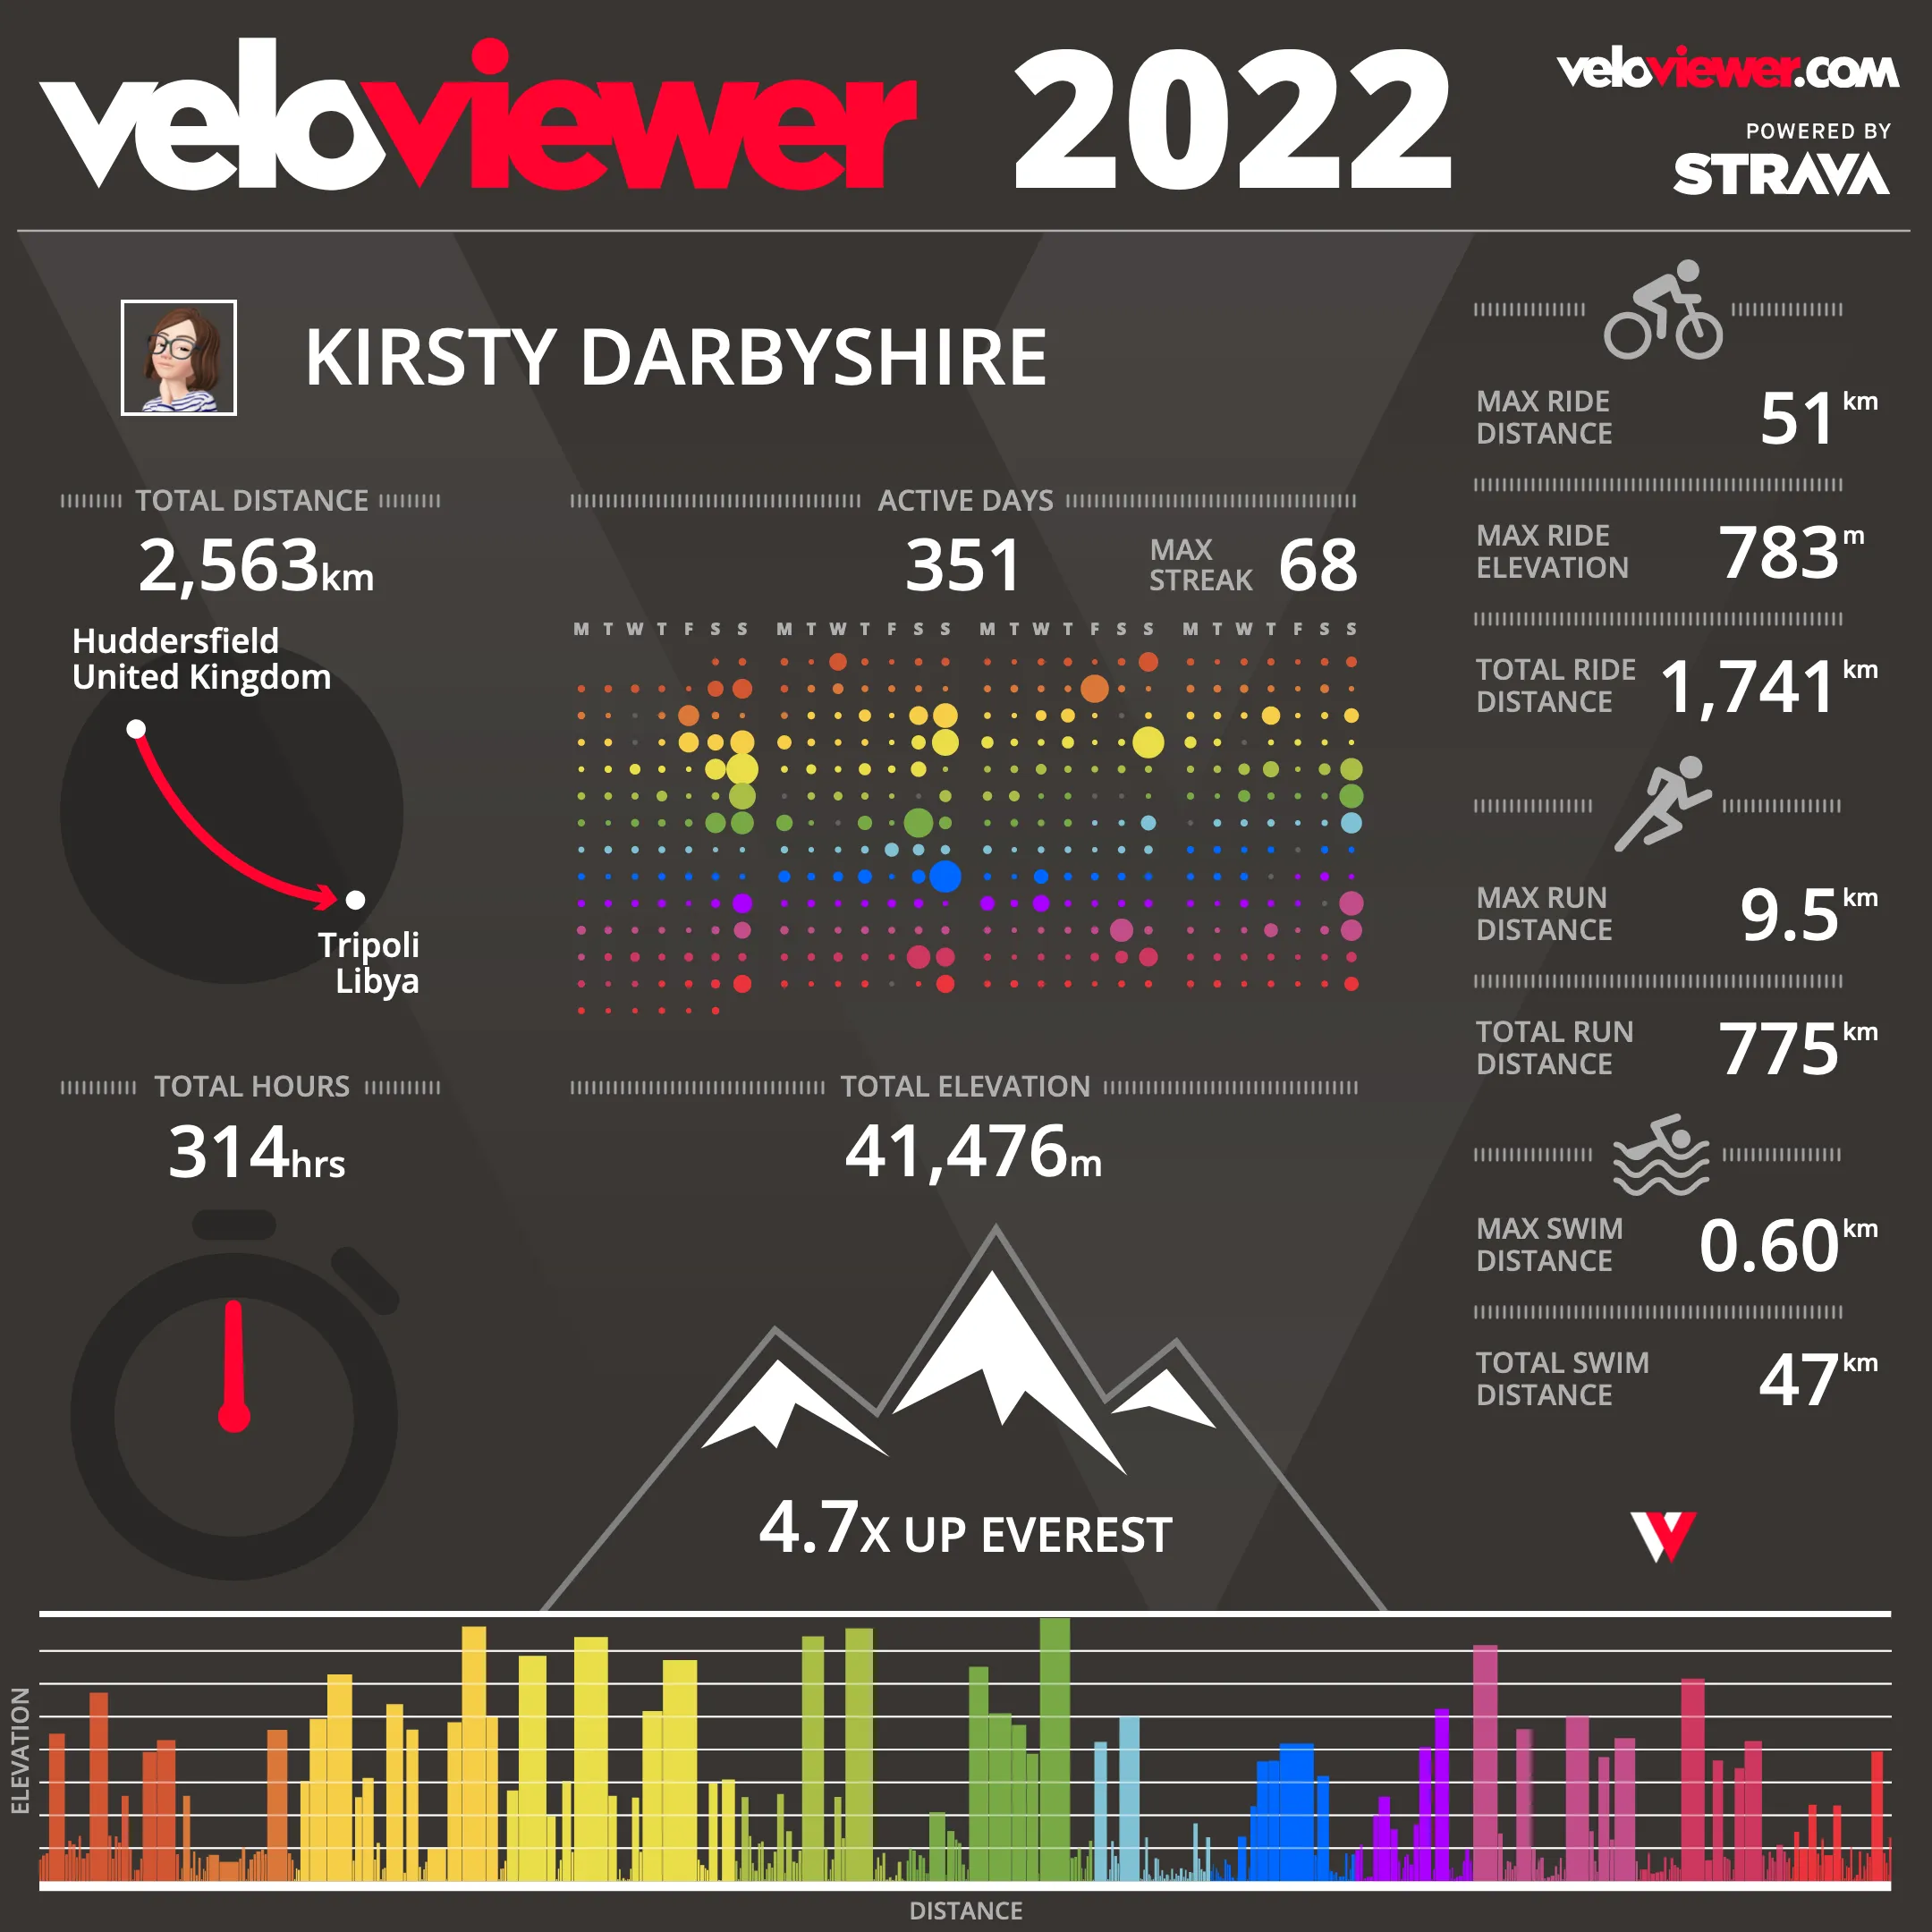
2022 in Veloviewer

Veloviewer, which I talked a lot about in my long overdue bike update gives you some lovely end of year statistics.
A few things to note:
- The first version of this graphic I looked at told me I’d got from Huddersfield to Moscow, which wouldn’t exactly have been my destination of choice this year even if I had have been riding in a straight line. Fortunately I realised a few last activities of December hadn’t made it to Strava and ended up in Tripoli after I updated.
- I rode my bike a bit less than I rode last year. I rode 2252km in 2021, but also there weren’t any lockdowns and the pool was open all year so I swam a bit further than the 38km I swam last year.
- I haven’t run anywhere for a long time, imagine the running stick figure is more of a walking/hiking one.
- I did walk further than last year though, it was exactly 500km last year. Almost a song in that!
- My longest bike ride was 51km, the exact same length as in 2021.
- My longest walk was quite a bit longer than in 2021, it was 6.4km last year.
- In my head I think I set aside an hour a day for exercise on average. But it only adds up to 314 hours over the year. I think that’s probably swimming bringing the average down as the hour in my head includes all the changing and drying malarkey as well.
- The 314 hours this year was still more than the 282 hours I spent in 2021.
- If I had to set an aim for 2023 it would be to spend more hours again. And maybe nudge past that 51km barrier that I seem to have for bike rides.
I was going to put an update on how I was doing on collecting the kilometre grid squares in Veloviewer here but I’m not sure anything has actually changed. In October I’d got to 144 in a cluster and now it seems to say 150 but I don’t think I’ve collected that many new ones through November and December so I think I’m probably reading something wrong. And I certainly haven’t got past an 11x11 square yet.


